Note
Go to the end to download the full example code.
Giese testing
Test comparison with Giese code and data
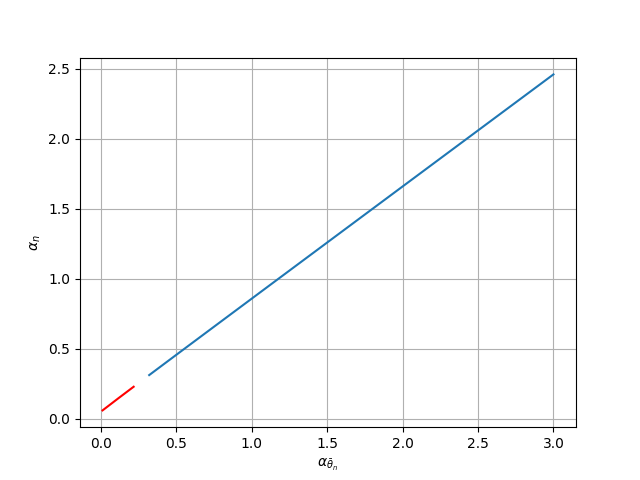
[0.05846558 0.14369864 0.22752788 0.31087347 0.39397903 0.47694308
 0.55981466 0.64262152 0.72538079 0.80810373 0.89079812 0.97346954
 1.05612212 1.138759   1.22138261 1.30399488 1.38659735 1.46919128
 1.55177771 1.6343575  1.71693138 1.79949997 1.88206379 1.96462331
 2.04717892 2.12973095 2.21227973 2.2948255  2.37736851 2.45990898]
import matplotlib.pyplot as plt
import numpy as np

from pttools.models import ConstCSModel
from examples.utils import save_and_show

model = ConstCSModel(css2=1/3, csb2=1/4, a_s=5, a_b=1, V_s=1)
atbs = np.linspace(0.01, 3, 30)
alpha_ns = np.zeros_like(atbs)
for i, alpha_theta_bar_n in enumerate(atbs):
    try:
        alpha_ns[i] = model.alpha_n_from_alpha_theta_bar_n(alpha_theta_bar_n=alpha_theta_bar_n)
    except RuntimeError:
        pass

print(alpha_ns)
fig = plt.figure()
ax = fig.add_subplot()
ax.plot(atbs[alpha_ns < atbs], alpha_ns[alpha_ns < atbs])
ax.plot(atbs[alpha_ns >= atbs], alpha_ns[alpha_ns >= atbs], color="red")

ax.set_xlabel(r"$\alpha_{\bar{\theta}_n}$")
ax.set_ylabel(r"$\alpha_n$")
ax.grid()


if __name__ == "__main__":
    save_and_show(fig, "giese_testing.png")
Total running time of the script: (0 minutes 0.734 seconds)
Estimated memory usage: 264 MB