Note
Go to the end to download the full example code.
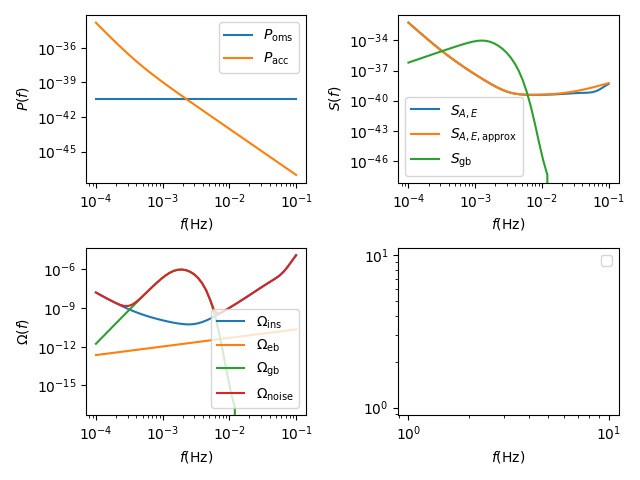
LISA noise
Plot LISA instrument and astrophysical noise as a function of frequency.
/home/docs/checkouts/readthedocs.org/user_builds/pttools/checkouts/stable/examples/props/noise.py:43: UserWarning:

No artists with labels found to put in legend.  Note that artists whose label start with an underscore are ignored when legend() is called with no argument.
from matplotlib import pyplot as plt
import numpy as np

from examples.utils import save_and_show
from pttools.omgw0 import noise


def main():
    fig: plt.Figure = plt.figure()
    axs = fig.subplots(2, 2)

    f = np.logspace(-4, -1, 50)
    ax1 = axs[0, 0]
    P_oms = noise.P_oms()
    ax1.plot([f.min(), f.max()], [P_oms, P_oms], label=r"$P_\text{oms}$")
    ax1.plot(f, noise.P_acc(f), label=r"$P_\text{acc}$")
    ax1.set_ylabel("$P(f)$")

    ax2 = axs[0, 1]
    ax2.plot(f, noise.S_AE(f), label="$S_{A,E}$")
    ax2.plot(f, noise.S_AE_approx(f), label=r"$S_{A,E,\text{approx}}$")
    ax2.plot(f, noise.S_gb(f), label=r"$S_\text{gb}$")
    ax2.set_ylabel("$S(f)$")

    ax3 = axs[1, 0]
    ax3.plot(f, noise.omega_ins(f), label=r"$\Omega_\text{ins}$")
    ax3.plot(f, noise.omega_eb(f), label=r"$\Omega_\text{eb}$")
    ax3.plot(f, noise.omega_gb(f), label=r"$\Omega_\text{gb}$")
    ax3.plot(f, noise.omega_noise(f), label=r"$\Omega_\text{noise}$")
    ax3.set_ylabel(r"$\Omega(f)$")

    for ax in axs.flat:
        ax.set_xlabel(r"$f(\text{Hz})$")
        ax.set_xscale("log")
        ax.set_yscale("log")
        ax.legend()
    fig.tight_layout()

    return fig


if __name__ == '__main__':
    fig = main()
    save_and_show(fig, "noise")
Total running time of the script: (0 minutes 2.231 seconds)
Estimated memory usage: 265 MB