Note
Go to the end to download the full example code.
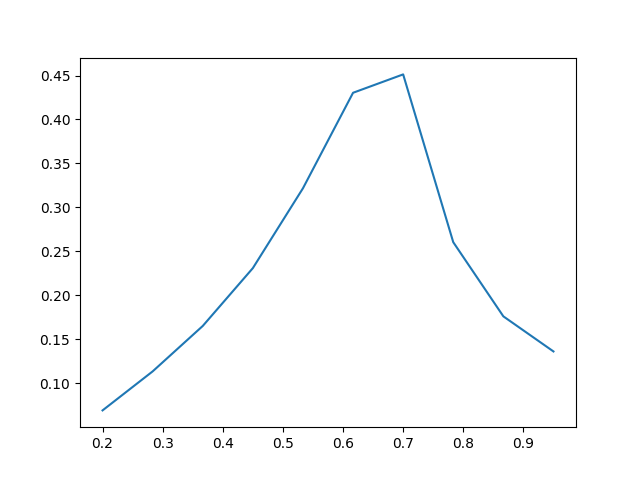
Compare kappa(xi) for old and new solvers
import logging
import time

import matplotlib.pyplot as plt
import numpy as np

from examples import utils
from pttools.bubble import quantities
from pttools.bubble.bubble import Bubble
from pttools.models.bag import BagModel

logger = logging.getLogger(__name__)


def main() -> plt.Figure:
    t_start = time.perf_counter()
    model = BagModel(a_s=1.1, a_b=1, V_s=1)
    v_walls = np.linspace(0.2, 0.95, 10)
    alpha_ns = np.array([0.1])

    fig: plt.Figure = plt.figure()
    ax: plt.Axes = fig.add_subplot()
    for alpha_n in alpha_ns:
        old = np.zeros_like(v_walls)
        new = np.zeros_like(v_walls)
        for i_v, v_wall in enumerate(v_walls):
            # Old
            old[i_v], _ = quantities.get_kappa_de_bag(v_wall, alpha_n)
            # New
            bubble = Bubble(model, v_wall, alpha_n)
            new[i_v] = bubble.kappa
        ax.plot(v_walls, new)

    logger.info(f"Elapsed time: {time.perf_counter() - t_start}")
    return fig


if __name__ == "__main__":
    fig = main()
    utils.save_and_show(fig, "xi_kappa_bag.png")
Total running time of the script: (0 minutes 3.310 seconds)
Estimated memory usage: 267 MB