Note
Go to the end to download the full example code.
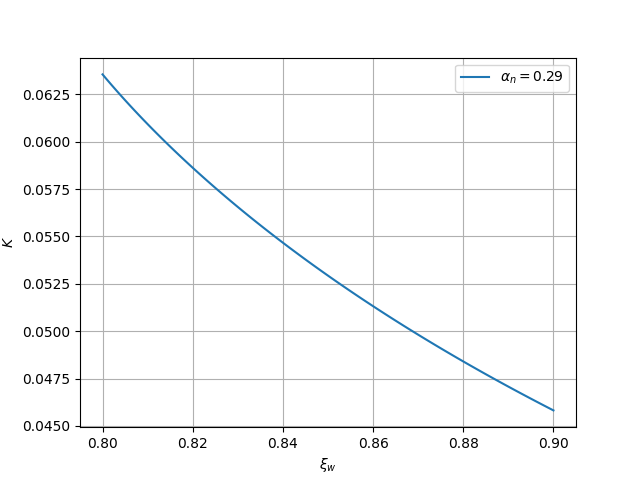
Kinetic energy fraction
Plot the kinetic energy fraction for various \(\alpha_n\) as a function of \(\xi_\text{wall}\)
0.2754830658241228
Peak: i=0, ke_frac=0.06355062289332492, v_wall=0.8, alpha_n=0.2854830658241228
import matplotlib.pyplot as plt
import numpy as np

from examples import utils
from pttools.bubble import get_ke_frac
from pttools.analysis.bubble_grid import create_bubbles
from pttools.models.const_cs import ConstCSModel


def main():
    # model = ConstCSModel(css2=1/3, csb2=1/3, a_s=100, a_b=50, V_s=1e-8, V_b=0)
    model = ConstCSModel(css2=1 / 3, csb2=1 / 4, a_s=5, a_b=1, V_s=1, V_b=0)
    print(model.alpha_n_min)
    # v_walls = np.linspace(0.05, 0.95, 100)
    v_walls = np.linspace(0.8, 0.9, 100)
    # alpha_ns = np.array([model.alpha_n_min, 0.2, 0.25])
    alpha_ns = np.array([model.alpha_n_min + 0.01])

    bubbles, ke_fracs = create_bubbles(
        model, v_walls=v_walls, alpha_ns=alpha_ns, func=get_ke_frac,
        # allow_bubble_failure=True,
        # bubble_kwargs={"allow_invalid": True}
    )
    i_max = np.nanargmax(ke_fracs[0])
    print(f"Peak: i={i_max}, ke_frac={ke_fracs[0, i_max]}, v_wall={v_walls[i_max]}, alpha_n={alpha_ns[0]}")

    fig: plt.Figure = plt.figure()
    ax: plt.Axes = fig.add_subplot()

    for i_alpha_n, alpha_n in enumerate(alpha_ns):
        ax.plot(v_walls, ke_fracs[i_alpha_n, :], label=rf"$\alpha_n={alpha_n:.2f}$")
    ax.set_xlabel(r"$\xi_w$")
    ax.set_ylabel(r"$K$")
    ax.grid()
    ax.legend()

    return fig


if __name__ == "__main__":
    fig = main()
    utils.save_and_show(fig, "ke_frac.png")
Total running time of the script: (0 minutes 2.420 seconds)
Estimated memory usage: 277 MB