Note
Go to the end to download the full example code.
v+, v- plane
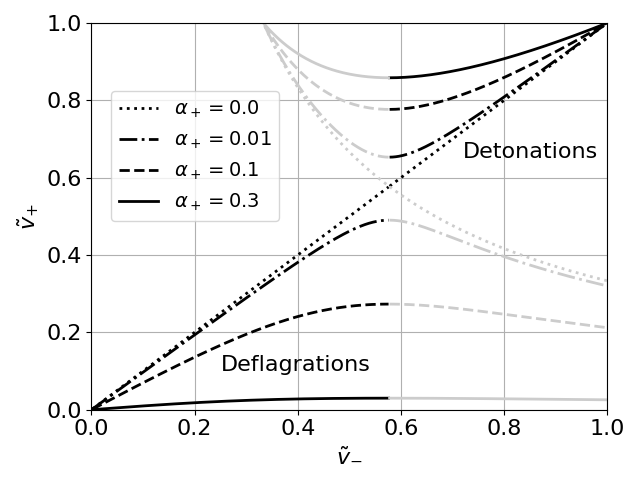
\({v}_+, {v}_-\) plane. Adapted from fig. 9 of Hindmarsh et al., 2019.
import numpy as np
import matplotlib.pyplot as plt

from examples.utils import save_and_show
from pttools import bubble


def main(dots: bool = False):
    # plt.rc('text', usetex=True)
    # plt.rc('font', family='serif')

    font_size = 16
    linewidth = 2
    # mpl.rcParams.update({'font.size': font_size})
    # # mpl.rcParams.update({'lines.linewidth': 1.5})
    # # mpl.rcParams.update({'axes.linewidth': 2.0})
    # mpl.rcParams.update({'axes.labelsize': font_size})
    # mpl.rcParams.update({'xtick.labelsize': font_size})
    # mpl.rcParams.update({'ytick.labelsize': font_size})
    # mpl.rcParams.update({'legend.fontsize': 14})

    npts = 500
    v_minus = np.linspace(1 / npts, 1, npts)

    alpha_plus_list = [0.0, 0.01, 0.1, 0.3]
    linestyle_list = [':', '-.', '--', '-']
    grey = 3 * [0.8]

    fig: plt.Figure = plt.figure()
    ax: plt.Axes = fig.add_subplot()

    for alpha, ls in zip(alpha_plus_list, linestyle_list):
        x1 = np.copy(v_minus)
        y1 = bubble.v_plus(v_minus, alpha, bubble.SolutionType.DETON)

        invisible1 = x1 < bubble.CS0
        x1_grey = x1[invisible1]
        y1_grey = y1[invisible1]
        x1[invisible1] = np.nan
        y1[invisible1] = np.nan

        ax.plot(
            x1, y1,
            linestyle=ls, color='k', linewidth=linewidth,
            label=r'$\alpha_+ = {}$'.format(alpha)
        )
        ax.plot(
            x1_grey, y1_grey,
            linestyle=ls, color=grey, linewidth=linewidth
        )

        x2 = np.copy(v_minus)
        y2 = bubble.v_plus(v_minus, alpha, bubble.SolutionType.SUB_DEF)

        invisible2 = x2 > bubble.CS0
        x2_grey = x2[invisible2]
        y2_grey = y2[invisible2]
        x2[invisible2] = np.nan
        y2[invisible2] = np.nan

        ax.plot(x2, y2, linestyle=ls, color='k', linewidth=linewidth)
        ax.plot(x2_grey, y2_grey, linestyle=ls, color=grey, linewidth=linewidth)

    # Blue dots
    if dots:
        ax.plot([0.5], [bubble.v_plus(0.5, 0.263, bubble.SolutionType.SUB_DEF)], 'bo')
        ax.plot([bubble.CS0], [bubble.v_plus(bubble.CS0, 0.052, bubble.SolutionType.SUB_DEF)], 'bo')
        ax.plot([bubble.v_minus(0.77, 0.091, bubble.SolutionType.DETON)], 0.77, 'bo')

    xmin = 0
    xmax = 1
    ymin = 0
    ymax = 1
    ax.axis([xmin, xmax, ymin, ymax])
    ax.set_xlabel(r'$\tilde{v}_{-}$')
    ax.set_ylabel(r'$\tilde{v}_{+}$')
    ax.text(0.25, 0.1, 'Deflagrations', fontsize=font_size)
    ax.text(0.72, 0.65, 'Detonations', fontsize=font_size)
    ax.legend(bbox_to_anchor=(0.02, 0.85), loc=2, prop={"size": 14})
    ax.grid()

    # for line in ax.lines:
    #     line.set_linewidth(1.5)
    # https://stackoverflow.com/a/14971193/
    for item in [ax.xaxis.label, ax.yaxis.label] + ax.get_xticklabels() + ax.get_yticklabels():
        item.set_fontsize(font_size)

    fig.tight_layout()
    return fig


if __name__ == "__main__":
    fig = main()
    save_and_show(fig, "vm_vp_plane")
Total running time of the script: (0 minutes 1.148 seconds)
Estimated memory usage: 264 MB