Note
Go to the end to download the full example code.
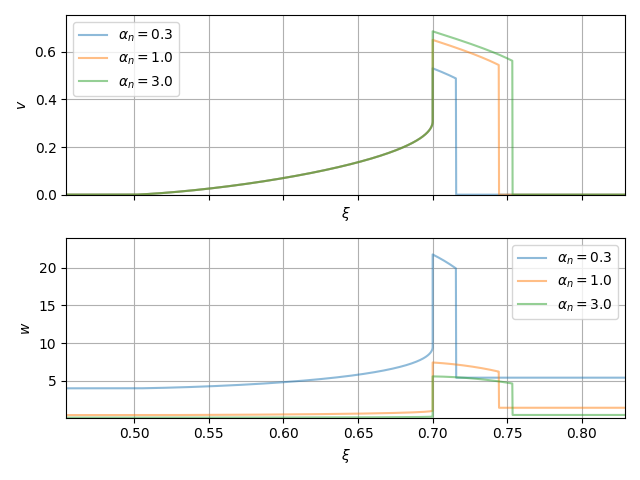
Giese bubble
Plot a single bubble using parameters from the code of Giese et al., 2021
import logging

import numpy as np

from examples.utils import save
from pttools import analysis
from pttools.bubble import Bubble
from pttools.models import ConstCSModel

logger = logging.getLogger(__name__)

model = ConstCSModel(css2=1/4, csb2=1/4, a_s=5, a_b=1, V_s=1)
alpha_ns = np.array([0.01, 0.03, 0.1, 0.3, 1, 3])
theta_bar = False
colors = ["b", "y", "r", "g", "purple", "grey"]
v_wall = 0.7

fig, ax_v, ax_w = analysis.setup_bubble_plot_multifig()

for alpha_n, color in zip(alpha_ns, colors):
    try:
        bubble = Bubble(model=model, v_wall=v_wall, alpha_n=alpha_n, theta_bar=theta_bar, allow_invalid=False)
        label = rf"$\alpha_{{\bar{{\theta}}_n}} = {alpha_n}$" if theta_bar else rf"$\alpha_n = {alpha_n}$"
        bubble.plot_v(fig=fig, ax=ax_v, alpha=0.5, label=label)
        bubble.plot_w(fig=fig, ax=ax_w, alpha=0.5, label=label)
    except (RuntimeError, ValueError) as e:
        logger.exception("ERROR:", exc_info=e)

fig.tight_layout()
save(fig, "giese_bubble")
Total running time of the script: (0 minutes 1.789 seconds)
Estimated memory usage: 263 MB