Examples

Examples on how to use PTtools to generate various figures.
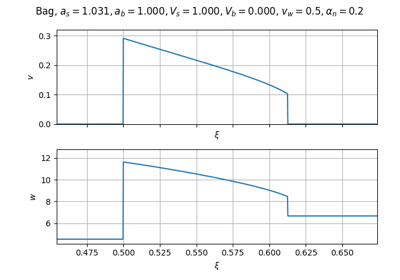
Basic

Basic examples on how to use PTtools.

Parallel

Parallel

Basic usage

Basic usage

Plot multiple spectra

Plot multiple spectra

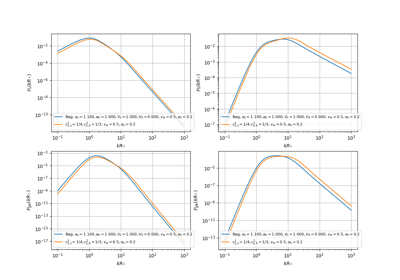
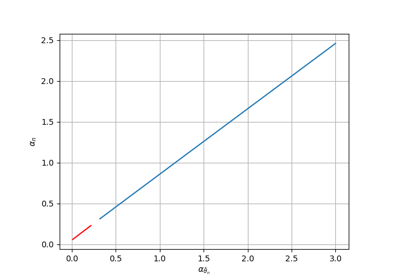
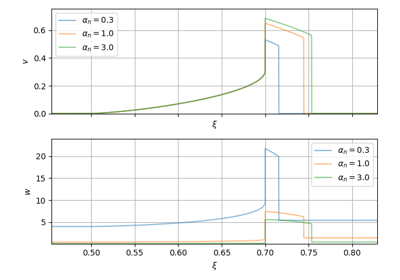
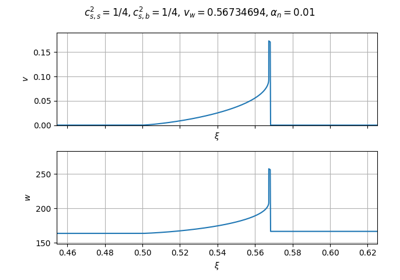
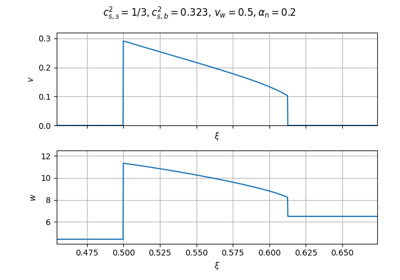
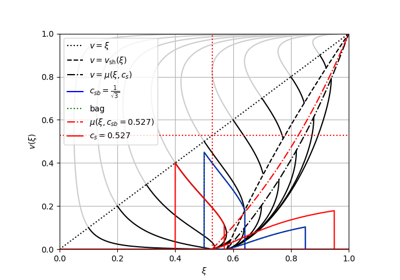
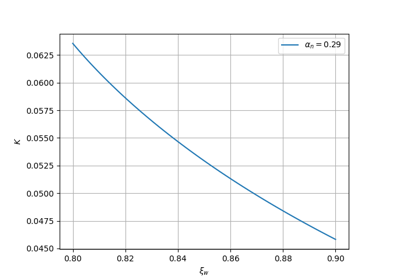
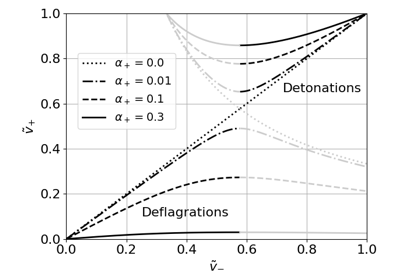
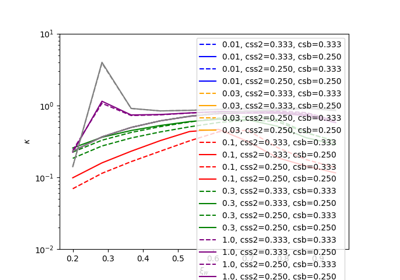
Constant \(c_s\) model

Examples for the constant \(c_s\) model.
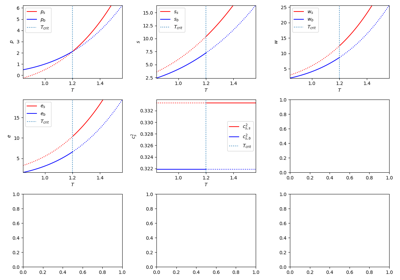
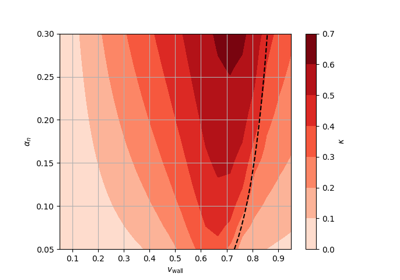
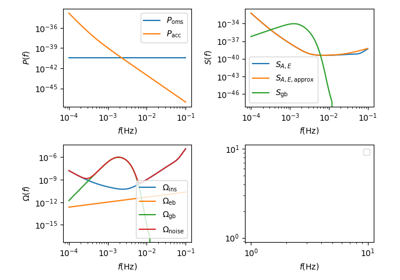
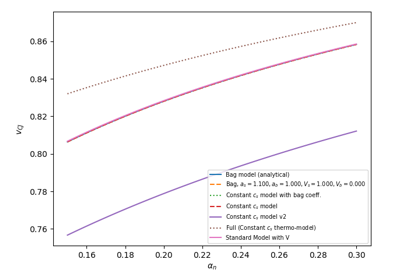
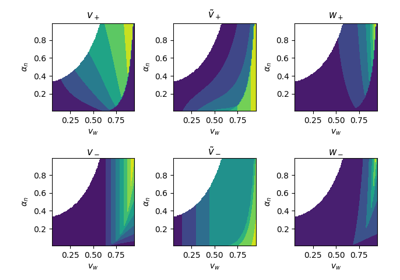
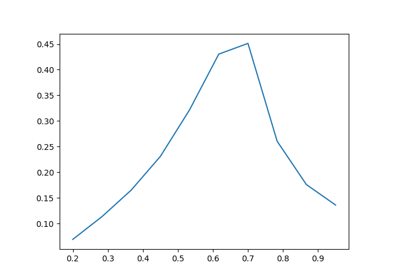
Finding alpha_n_min for ConstCSModel

Finding alpha_n_min for ConstCSModel

ConstCSModel testing

ConstCSModel testing

ConstCSModel

ConstCSModel

Comparison of BagModel and ConstCSModel

Comparison of BagModel and ConstCSModel

ConstCSModel xi, v plane

ConstCSModel xi, v plane

ConstCSModel 3D

ConstCSModel 3D

GW spectra for ConstCSModel

GW spectra for ConstCSModel

Properties

Examples on how to extract and plot various properties from the solutions.
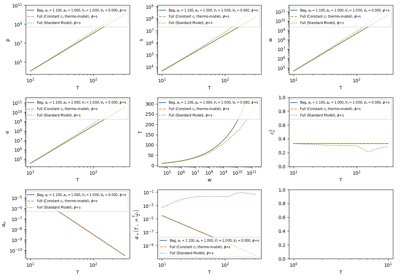
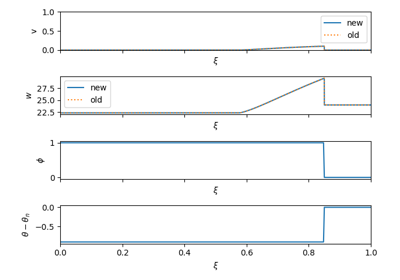
Delta-Theta

Delta-Theta

LISA noise

LISA noise

wn by w_center

wn by w_center

Kinetic energy fraction

Kinetic energy fraction

Chapman-Jouguet speed

Chapman-Jouguet speed

Bag model reference properties

Bag model reference properties

v+, v- plane

v+, v- plane

Plot κ(ξ) for various models

Plot κ(ξ) for various models

Solvers

Script and figures for comparing the old bag model specific solver with the new generic solver.
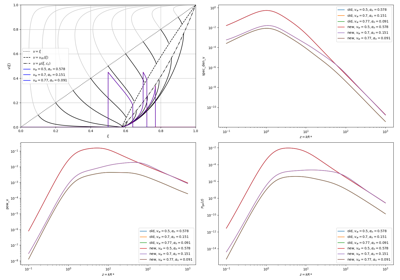
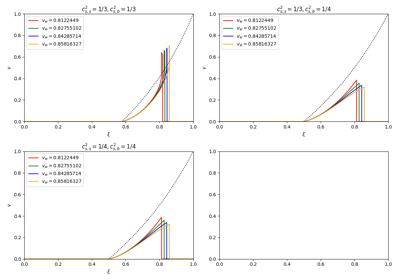
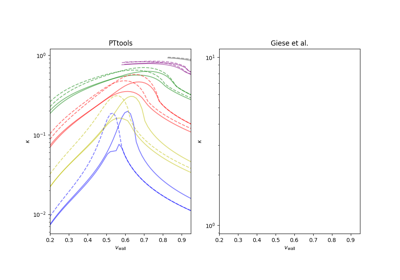
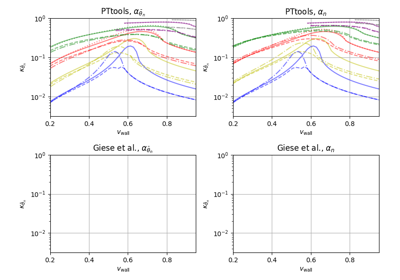
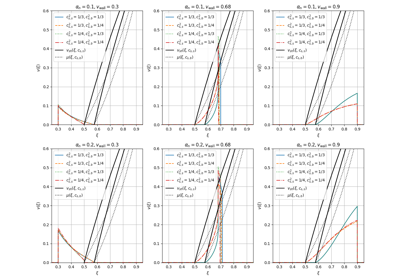
Compare kappa(xi) for old and new solvers

Compare kappa(xi) for old and new solvers

Bag model

Bag model

Old-new comparison

Old-new comparison

Giese

Scripts and figures to compare PTtools with the constant \(c_s\) model code by Giese et al. These examples require the Giese et al. code to be present, and are therefore not properly plotted in the online documentation.

Giese testing

Giese testing

Giese bubble

Giese bubble

Giese testing 3

Giese testing 3

Giese testing 2

Giese testing 2

Comparison of Giese and PTtools solvers

Comparison of Giese and PTtools solvers

Giese LISA fig. 2

Giese LISA fig. 2

Gallery generated by Sphinx-Gallery