Note
Go to the end to download the full example code.
Basic usage
Plot a single bubble
import matplotlib.pyplot as plt
from examples.utils import save
from pttools.bubble import Bubble
from pttools.models import BagModel
from pttools.ssmtools import NucType
from pttools.omgw0 import Spectrum
def main():
# Create the equation of state.
# If you don't specify a_s and a_b or g_s and g_b,
# you have to specify a minimum alpha_n for which the model will be valid.
model = BagModel(alpha_n_min=0.01)
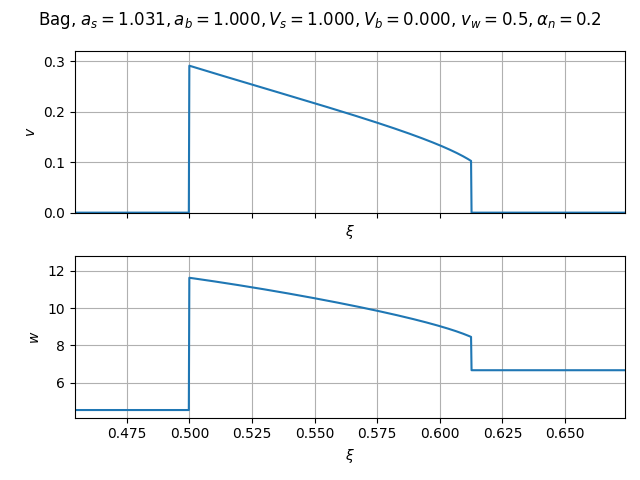
# Create and simulate the fluid profile of a bubble.
bubble = Bubble(model, v_wall=0.5, alpha_n=0.2)
bubble_fig = bubble.plot()
save(bubble_fig, "bag_bubble.png")
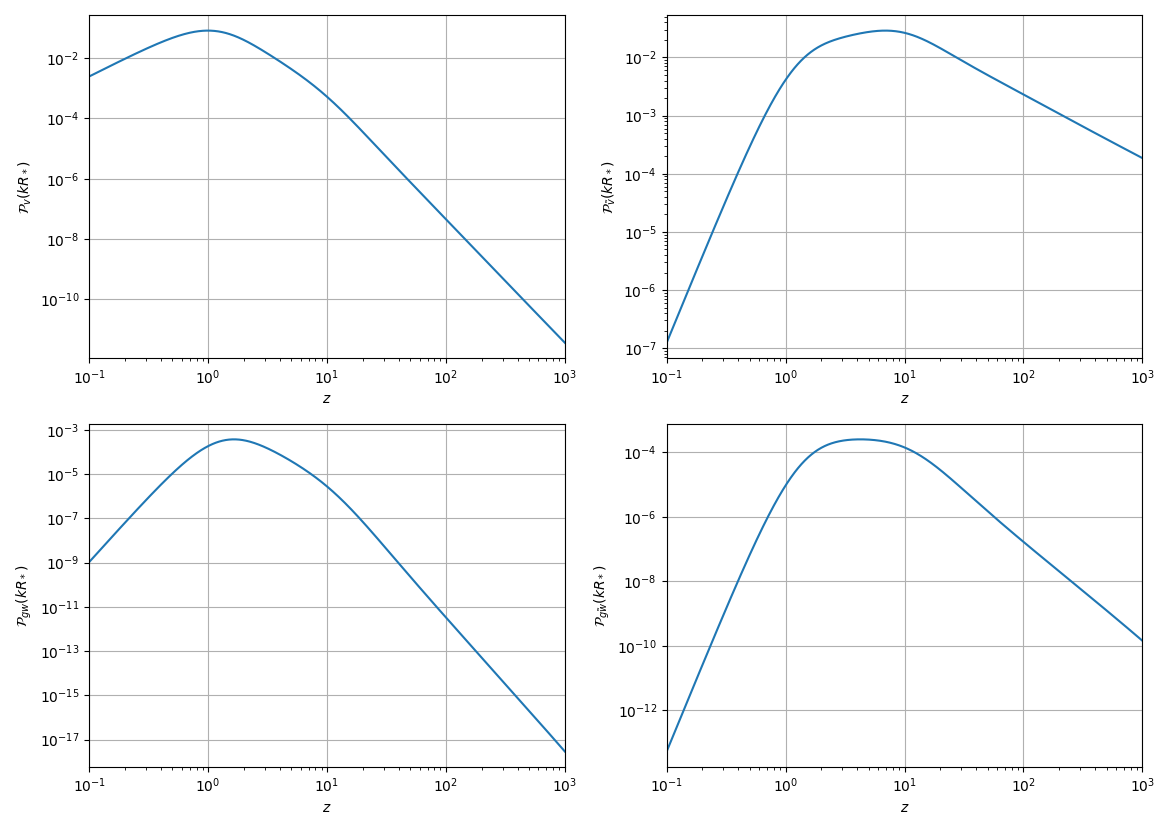
# Compute the gravitational wave spectrum for the bubble.
spectrum = Spectrum(bubble, nuc_type=NucType.EXPONENTIAL)
spectrum_fig = spectrum.plot_multi()
save(spectrum_fig, "bag_spectrum.png")
if __name__ == "__main__":
main()
plt.show()
Total running time of the script: (0 minutes 42.583 seconds)
Estimated memory usage: 606 MB