Note
Go to the end to download the full example code.
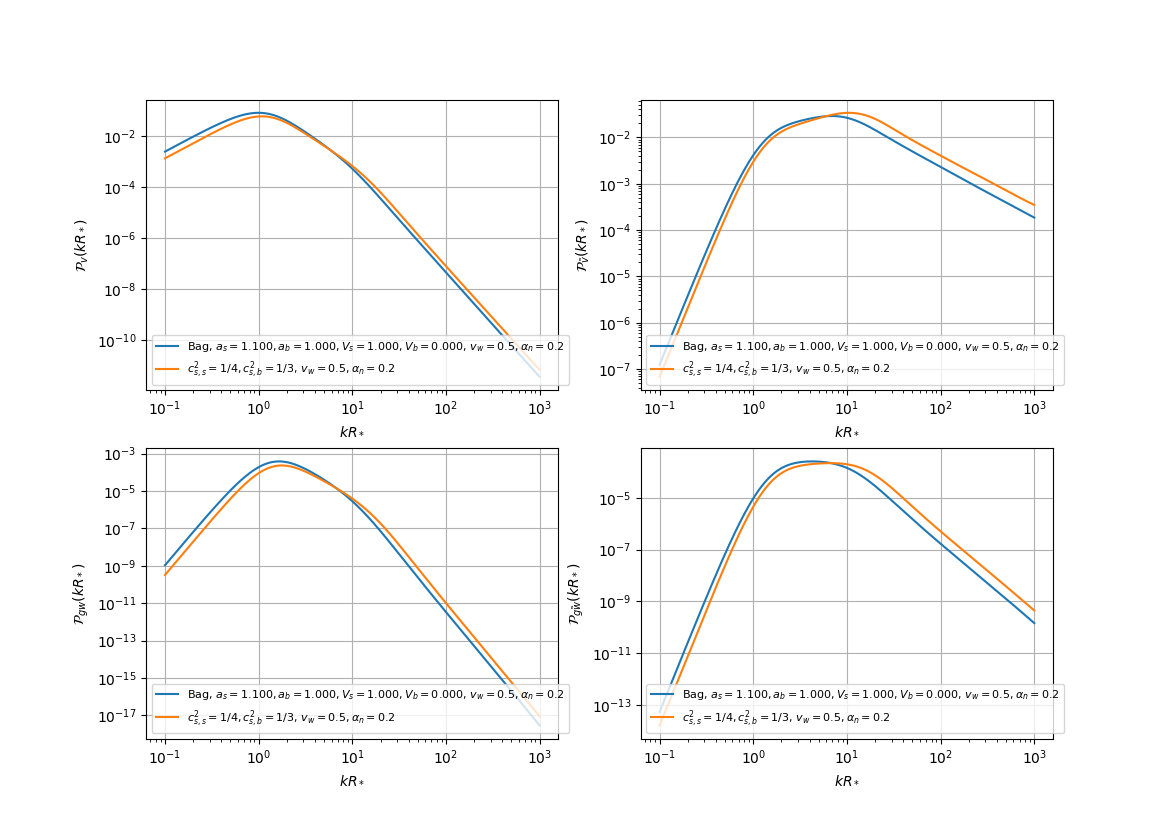
Plot multiple spectra
Plot the velocity and GW spectra of multiple bubbles
import matplotlib.pyplot as plt

from examples import utils
from pttools.analysis import plot_spectra
from pttools.bubble import Bubble
from pttools.models import BagModel, ConstCSModel
from pttools.omgw0 import Spectrum


def main() -> plt.Figure:
    # Create the equations of state
    model1 = BagModel(alpha_n_min=0.1)
    # Instead of giving alpha_n_min you can give a_s, a_b and V_s to specify a model.
    model2 = ConstCSModel(
        css2=1/4,  # speed of sound in the symmetric phase
        csb2=1/3,  # speed of sound in the broken phase
        a_s=1.5,   # degrees of freedom coefficient for the equation of state in the symmetric phase
        a_b=1,     # degrees of freedom coefficient for the equation of state in the broken phase
        V_s=1      # potential in the symmetric phase
    )
    # Create the bubbles
    bubbles = [
        Bubble(model1, v_wall=0.5, alpha_n=0.2),
        Bubble(model2, v_wall=0.5, alpha_n=0.2)
    ]
    # Convert the bubbles to GW spectra
    spectra = [Spectrum(bubble) for bubble in bubbles]

    return plot_spectra(spectra)


if __name__ == "__main__":
    fig = main()
    utils.save_and_show(fig, "spectra.png")
Total running time of the script: (0 minutes 4.172 seconds)
Estimated memory usage: 271 MB