Note
Go to the end to download the full example code.
ConstCSModel
Plot various quantities for the constant sound speed model
import matplotlib.pyplot as plt
import numpy as np
from examples.utils import save
from pttools.bubble import Bubble
from pttools.models import ConstCSModel
from pttools.analysis.plot_model import ModelPlot
from pttools.ssmtools import NucType
from pttools.omgw0 import Spectrum
def main():
csb = 1 / np.sqrt(3) - 0.01
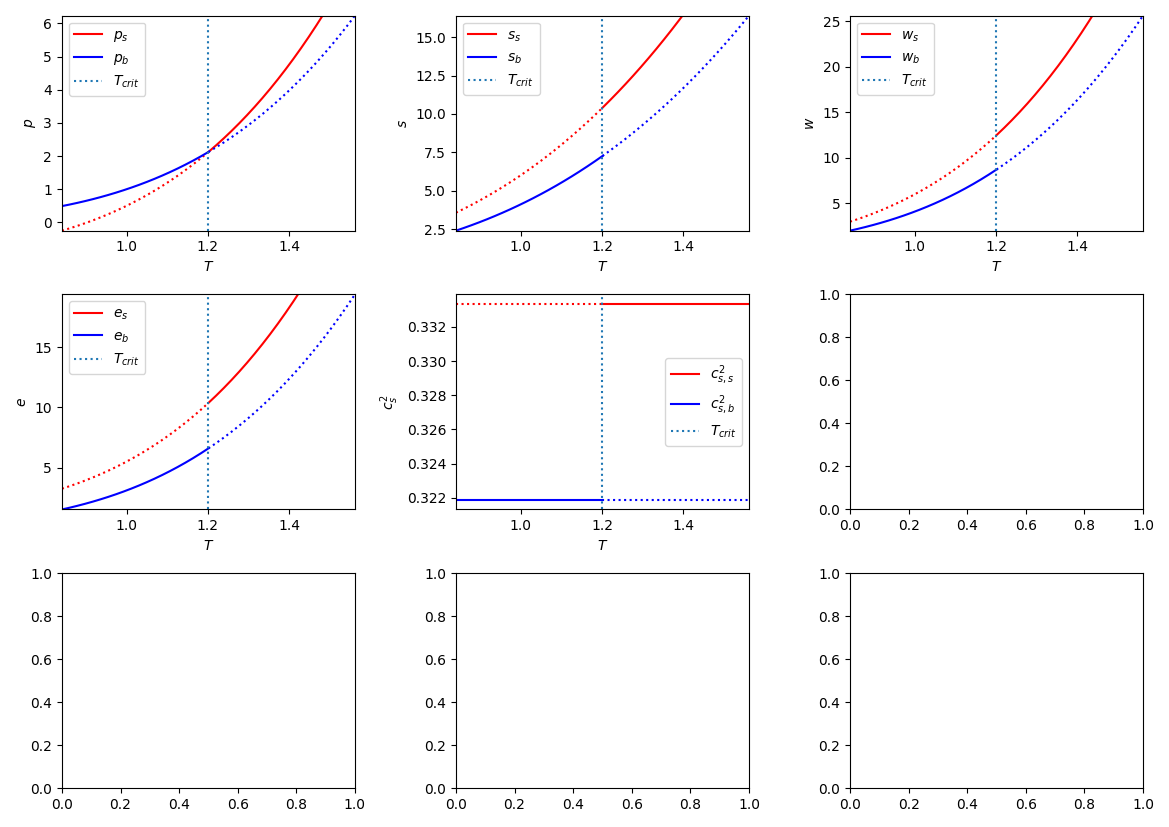
const_cs = ConstCSModel(a_s=1.5, a_b=1, css2=1/3, csb2=csb**2, V_s=1)
model_plot = ModelPlot(const_cs, t_log=False, y_log=False)
save(model_plot.fig, "const_cs.png")
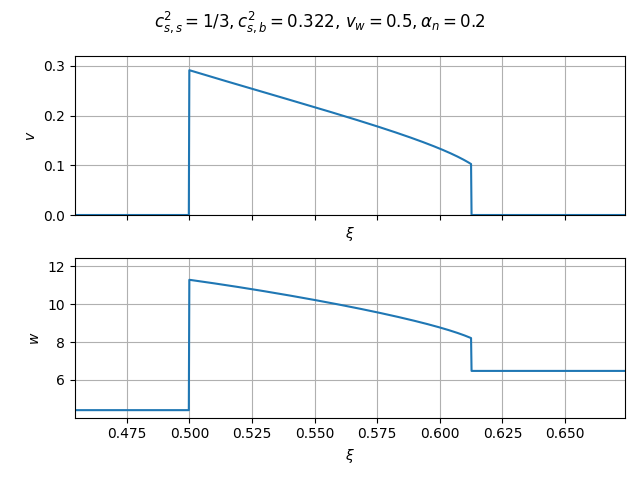
bubble = Bubble(const_cs, v_wall=0.5, alpha_n=0.2)
bubble_fig = bubble.plot()
save(bubble_fig, "const_cs_bubble.png")
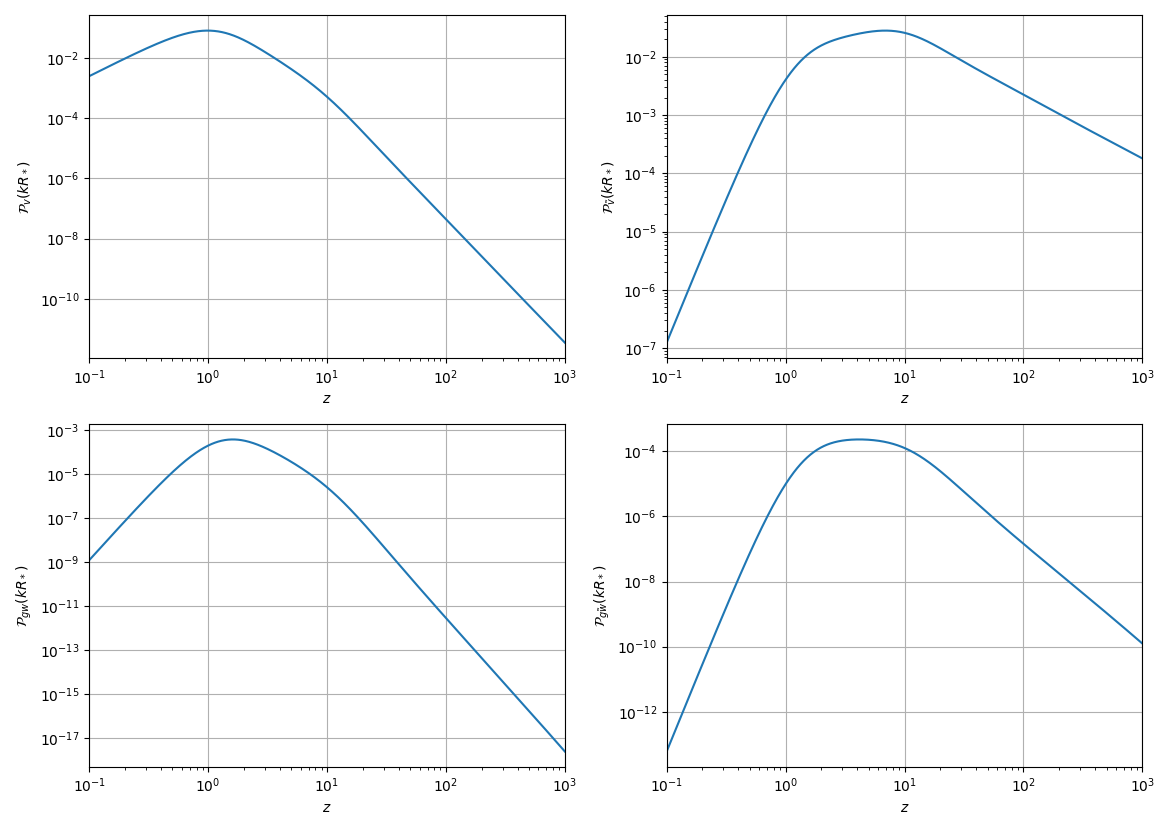
spectrum = Spectrum(bubble, nuc_type=NucType.EXPONENTIAL)
spectrum_fig = spectrum.plot_multi()
save(spectrum_fig, "const_cs_spectrum.png")
if __name__ == "__main__":
main()
plt.show()
Total running time of the script: (0 minutes 4.706 seconds)
Estimated memory usage: 270 MB