Note
Go to the end to download the full example code.
GW spectra for ConstCSModel
Plot GW spectra for various ConstCSModels
These figures and this table are used in Mika’s M.Sc. thesis.
/home/docs/checkouts/readthedocs.org/user_builds/pttools/checkouts/main/pttools/models/const_cs.py:681: RuntimeWarning:

invalid value encountered in scalar multiply

Generating the figures took 41.55147002600279 s
import io
import logging
import os.path
import time
import matplotlib.pyplot as plt
import numpy as np
from examples import utils
from pttools.bubble import lorentz
from pttools.bubble.shock import shock_curve
from pttools.models import ConstCSModel
from pttools.omgw0 import Spectrum, omega_ins
from pttools.analysis.parallel import create_spectra
# from pttools.analysis.utils import A3_PAPER_SIZE, A4_PAPER_SIZE
from pttools.speedup.options import IS_READ_THE_DOCS
logger = logging.getLogger(__name__)
def main():
start_time = time.perf_counter()
a_s = 5
a_b = 1
V_s = 1
r_star = 0.1
Tn = 200
# v_walls: np.ndarray = np.array([0.4, 0.7, 0.8])
# v_walls: np.ndarray = np.array([0.4, 0.67, 0.84])
v_walls: np.ndarray = np.array([0.3, 0.68, 0.9])
alpha_ns: np.ndarray = np.array([0.1, 0.2])
alpha_n_min = np.min(alpha_ns)
allow_invalid = False
models = [
ConstCSModel(css2=1/3, csb2=1/3, a_s=a_s, a_b=a_b, V_s=V_s, alpha_n_min=alpha_n_min, allow_invalid=allow_invalid),
ConstCSModel(css2=1/3, csb2=1/4, a_s=a_s, a_b=a_b, V_s=V_s, alpha_n_min=alpha_n_min, allow_invalid=allow_invalid),
ConstCSModel(css2=1/4, csb2=1/3, a_s=a_s, a_b=a_b, V_s=V_s, alpha_n_min=alpha_n_min, allow_invalid=allow_invalid),
ConstCSModel(css2=1/4, csb2=1/4, a_s=a_s, a_b=a_b, V_s=V_s, alpha_n_min=alpha_n_min, allow_invalid=allow_invalid),
]
lss = ["solid", "dashed", "dotted", "dashdot"]
# css2s = {model.css2 for model in models}
csb2s = {model.csb2 for model in models}
alpha_n_mins = np.array([model.alpha_n_min for model in models])
if np.any(alpha_n_mins > alpha_n_min):
msg = f"A model has alpha_n_min > {alpha_n_min}. Please adjust the models. Currently alpha_n_mins={alpha_n_mins}",
logger.error(msg)
raise ValueError(msg)
spectra: np.ndarray = np.zeros((len(models), alpha_ns.size, v_walls.size), dtype=object)
# z = np.logspace(-1, 3, 5000)
for i_model, model in enumerate(models):
spectra[i_model, :, :] = create_spectra(
model=model, v_walls=v_walls, alpha_ns=alpha_ns,
# spectrum_kwargs={"source_duration": 1},
spectrum_kwargs={
"r_star": r_star,
# "z": z
"Tn": Tn,
# "g_star": 100,
# "gs_star": 100
},
# bubble_kwargs={"allow_invalid": False}, allow_bubble_failure=True,
# This fixes a BrokenProcessPool error on Read the Docs
single_thread=IS_READ_THE_DOCS
)
figsize = (12, 10)
fig1: plt.Figure = plt.figure(figsize=figsize)
fig2: plt.Figure = plt.figure(figsize=figsize)
fig3: plt.Figure = plt.figure(figsize=figsize)
axs1: np.ndarray = fig1.subplots(alpha_ns.size, v_walls.size)
axs2: np.ndarray = fig2.subplots(alpha_ns.size, v_walls.size)
axs3: np.ndarray = fig3.subplots(alpha_ns.size, v_walls.size)
snrs = np.zeros((len(alpha_ns), len(v_walls), len(models)))
for i_alpha_n, alpha_n in enumerate(alpha_ns):
for i_v_wall, v_wall in enumerate(v_walls):
ax1: plt.Axes = axs1[i_alpha_n, i_v_wall]
ax2: plt.Axes = axs2[i_alpha_n, i_v_wall]
ax3: plt.Axes = axs3[i_alpha_n, i_v_wall]
for i_model, model in enumerate(models):
spectrum: Spectrum = spectra[i_model, i_alpha_n, i_v_wall]
if spectrum is not None:
label = model.label_latex_params
snr = spectrum.signal_to_noise_ratio_instrument()
snrs[i_alpha_n, i_v_wall, i_model] = snr
label2 = f"{label[:-1]}, SNR={snr:.1f}$"
ls = lss[i_model]
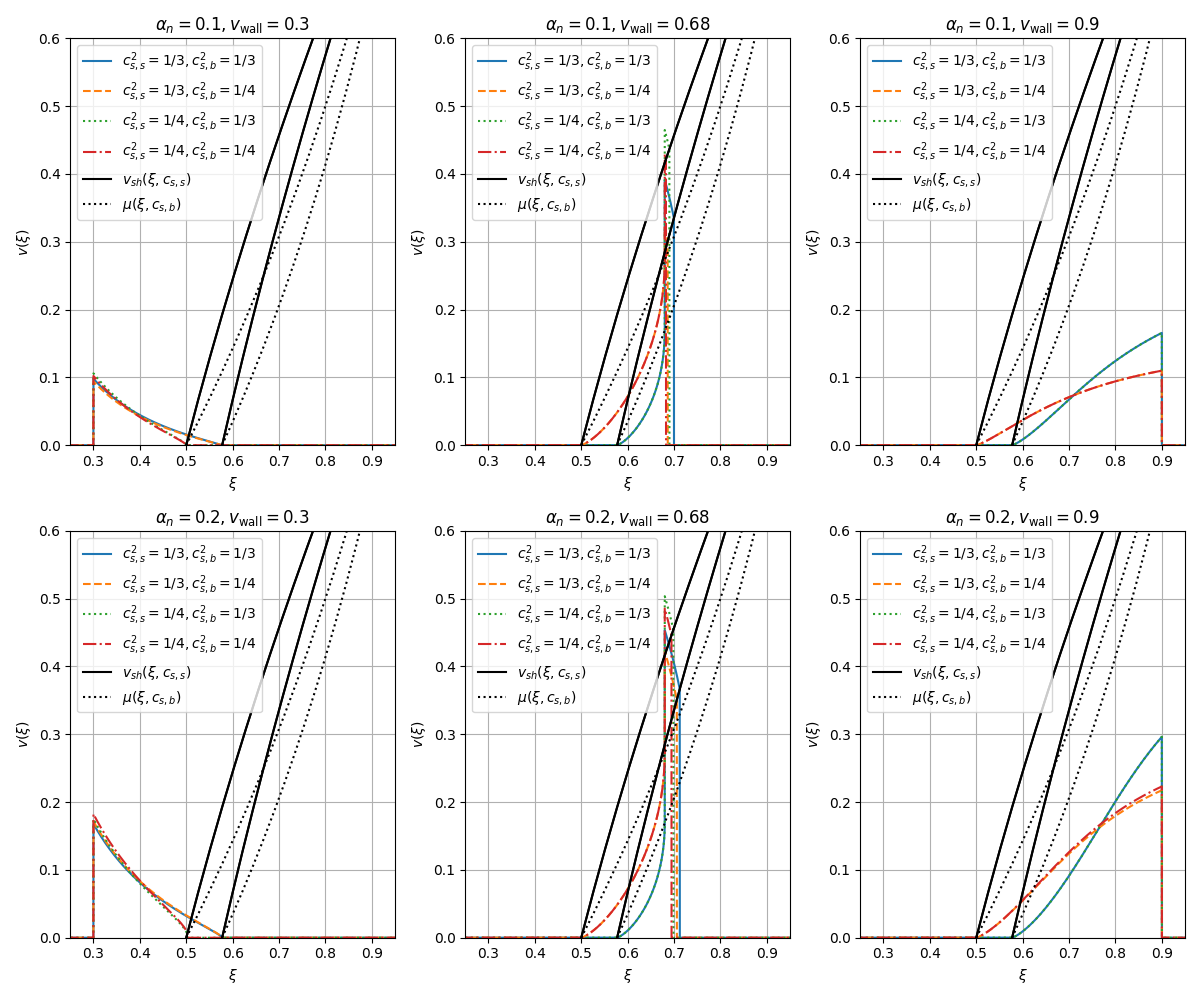
ax1.plot(spectrum.bubble.xi, spectrum.bubble.v, label=label, ls=ls)
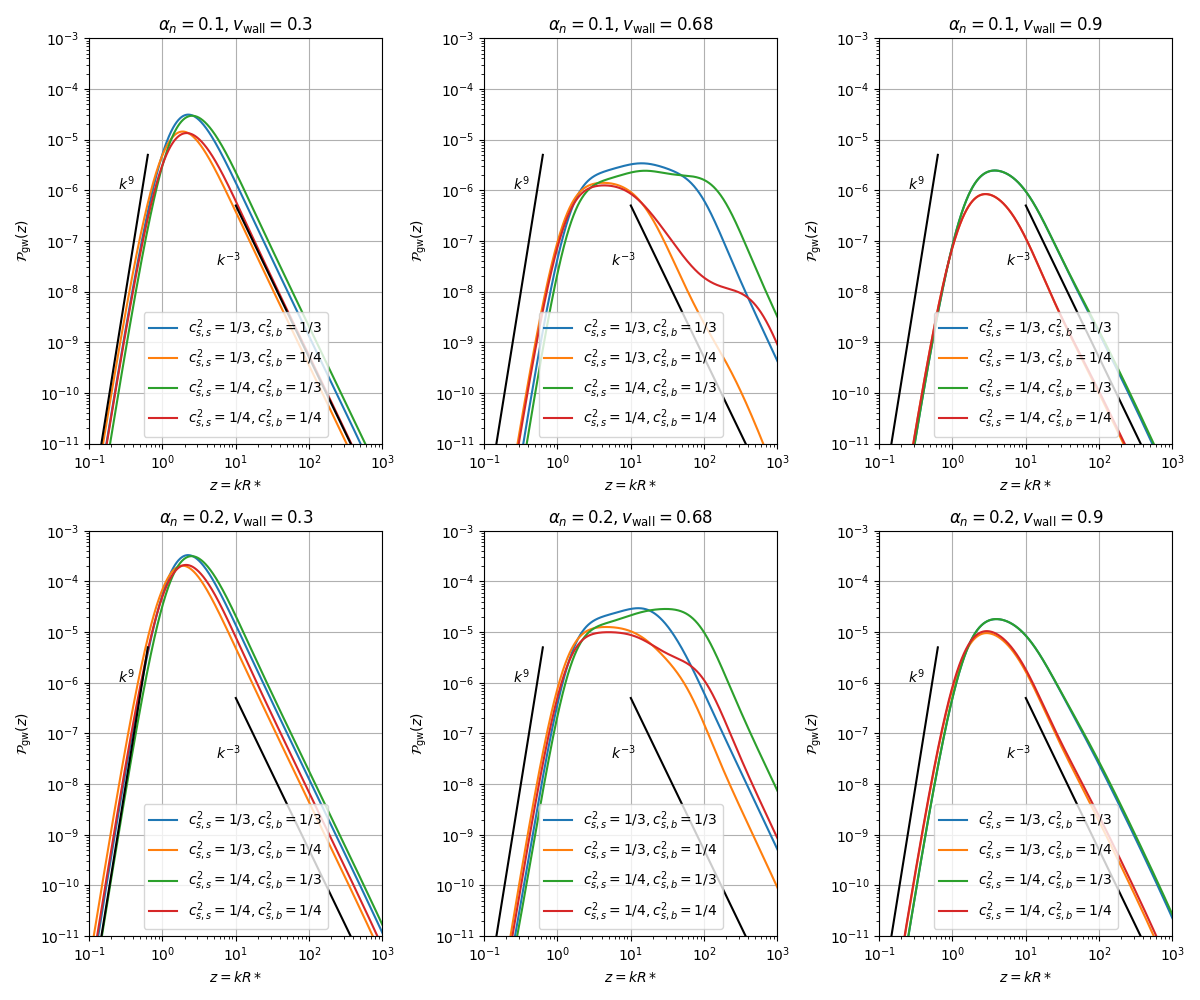
ax2.plot(spectrum.y, spectrum.pow_gw, label=label)
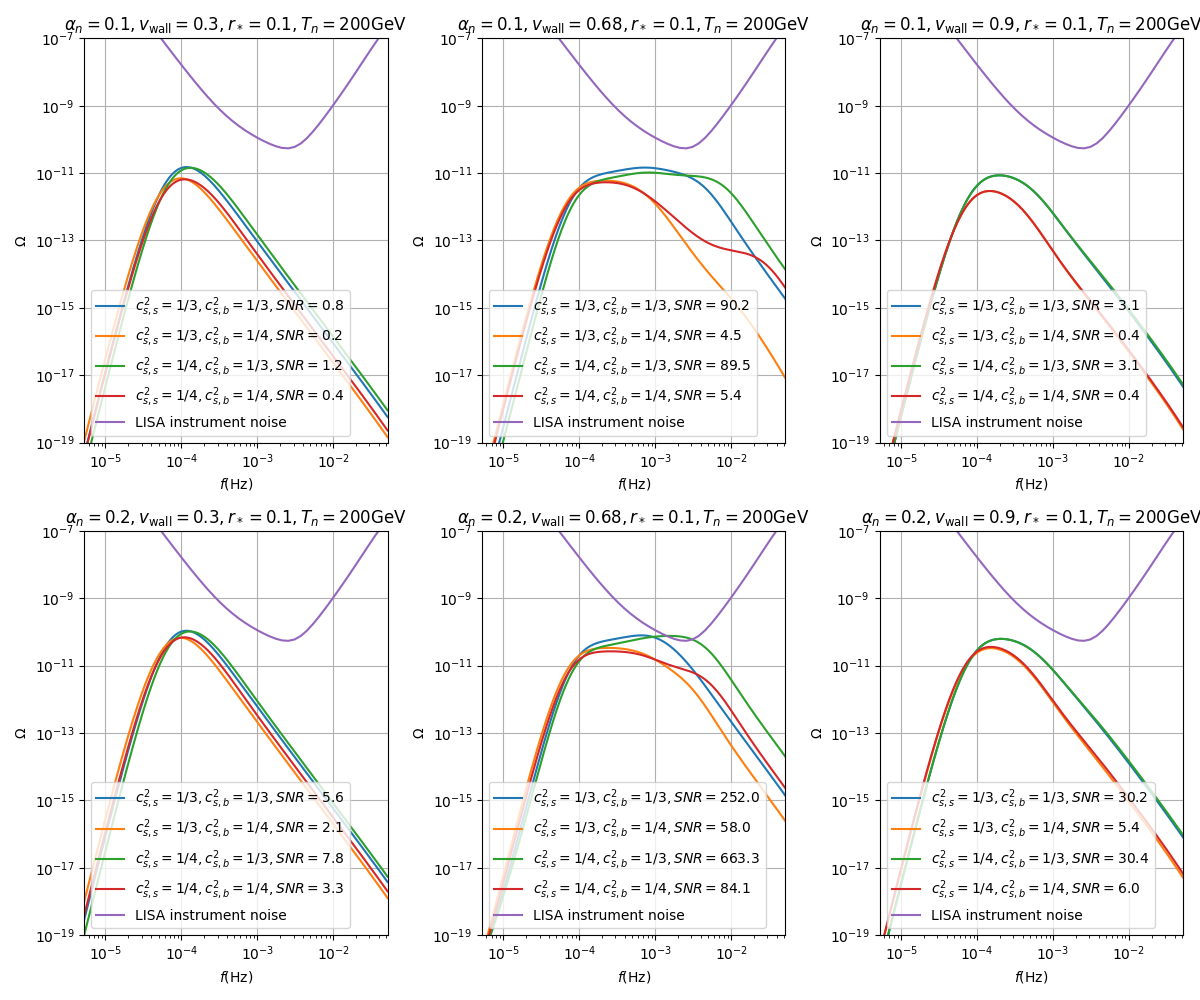
ax3.plot(spectrum.f(), spectrum.omgw0(), label=label2)
title = rf"$\alpha_n={alpha_n}, v_\text{{wall}}={v_wall}$"
ax1.set_xlabel(r"$\xi$")
ax1.set_ylabel(r"$v(\xi)$")
ax1.grid()
ax1.set_title(title)
ax2.set_xscale("log")
ax2.set_yscale("log")
ax2.set_xlabel("$z = kR*$")
ax2.set_ylabel(r"$\mathcal{P}_{\text{gw}}(z)$")
ax2.grid()
ax2.set_title(title)
ax3.set_xscale("log")
ax3.set_yscale("log")
ax3.set_xlabel(r"$f(\text{Hz})$")
ax3.set_ylabel(r"$\Omega$")
ax3.grid()
ax3.set_title(title[:-1] + rf", r_*={r_star}, T_n={Tn} \text{{GeV}}$")
file: io.StringIO
with io.StringIO() as file:
file.writelines([
"\\begin{table}\n",
"\\centering\n",
"\\caption{Signal-to-noise ratios of the gravitational wave power spectra of fig \\ref{fig:omgw0}}\n",
"\\begin{tabular}{l|l|l|l}\n",
"Model & \\multicolumn{3}{l}{$\\v_\\text{wall}$} \\\\\n"
"& " + " & ".join([f"{v_wall:.2f}" for v_wall in v_walls]) + "\n",
"\\hline \\\\\n"
])
for i_alpha_n, alpha_n in enumerate(alpha_ns):
for i_model, model in enumerate(models):
file.write(
model.label_latex_params + " & " + \
" & ".join([f"{snr:.1f}" for snr in snrs[i_alpha_n, :, i_model]]))
if i_model < len(models) - 1:
file.write(" \\\\\n")
if i_alpha_n < len(alpha_ns) - 1:
file.write(" \\hline \\\\\n")
else:
file.write(" \\\\\n")
file.writelines([
"\\end{tabular}\n",
"\\label{table:const_cs_gw_snr}\n",
"\\end{table}\n"
])
table = file.getvalue()
# Shock surfaces
n_xi = 20
for i_model, model in enumerate(models):
xi_arr: np.ndarray = np.linspace(model.css, 0.99, n_xi)
for i_alpha_n, alpha_n in enumerate(alpha_ns):
vm_arr = shock_curve(model, alpha_n, xi_arr)
for i_v_wall, v_wall in enumerate(v_walls):
ax: plt.Axes = axs1[i_alpha_n, i_v_wall]
if i_model:
ax.plot(xi_arr, vm_arr, color="k")
else:
ax.plot(xi_arr, vm_arr, color="k", label=r"$v_{sh}(\xi, c_{s,s})$")
# Mu curves
for i_csb2, csb2 in enumerate(csb2s):
csb = np.sqrt(csb2)
xi_mu: np.ndarray = np.linspace(csb, 1, 20)
v_mu = lorentz(xi=xi_mu, v=csb)
for ax in axs1.flat:
if i_csb2:
ax.plot(xi_mu, v_mu, ls=":", c="k")
else:
ax.plot(xi_mu, v_mu, ls=":", c="k", label=r"$\mu(\xi, c_{s,b})$")
# Noise curves
f_min = np.min([spectrum.f(z=spectrum.y[0]) for spectrum in spectra.flat])
f_max = np.max([spectrum.f(z=spectrum.y[-1]) for spectrum in spectra.flat])
f: np.ndarray = np.logspace(np.log10(f_min), np.log10(f_max), num=50)
for i_alpha_n, alpha_n in enumerate(alpha_ns):
for i_v_wall, v_wall in enumerate(v_walls):
ax: plt.Axes = axs3[i_alpha_n, i_v_wall]
# ax.plot(f, omega_noise(f), label="LISA overall noise")
ax.plot(f, omega_ins(f), label="LISA instrument noise")
# Lines
pow_low = 9
k_low = np.logspace(-1, -0.2, 10)
p_low = k_low**pow_low * 10**(-3.5)
for ax in axs2.flat:
ax.plot(k_low, p_low, color="k")
ax.text(0.25, 10**(-6), f"$k^{pow_low}$")
pow_high = -3
k_high = np.logspace(1, 3, 10)
p_high = k_high**pow_high * 10**(-3.3)
for ax in axs2.flat:
ax.plot(k_high, p_high, color="k")
ax.text(5.3, 10**(-7.5), f"$k^{{{pow_high}}}$")
for ax in axs1.flat:
ax.set_xlim(0.25, 0.95)
ax.set_ylim(0, 0.6)
ax.legend(loc="upper left")
for ax in axs2.flat:
ax.set_xlim(spectra[0, 0, 0].y[0], spectra[0, 0, 0].y[-1])
ax.set_ylim(10e-12, 10e-4)
ax.legend(loc="lower center")
for ax in axs3.flat:
ax.set_xlim(f_min, f_max)
ax.set_ylim(1e-19, 1e-7)
ax.legend(loc="lower left")
fig1.tight_layout()
fig2.tight_layout()
fig3.tight_layout()
print(f"Generating the figures took {time.perf_counter() - start_time} s")
return fig1, fig2, fig3, table
if __name__ == "__main__":
figs = main()
utils.save(figs[0], "const_cs_gw_v")
utils.save(figs[1], "const_cs_gw")
utils.save(figs[2], "const_cs_gw_omgw0")
with open(os.path.join(utils.FIG_DIR, "const_cs_gw_snr.tex"), "w") as table_file:
table_file.write(figs[3])
plt.show()
Total running time of the script: (0 minutes 55.345 seconds)
Estimated memory usage: 311 MB