Note
Go to the end to download the full example code.
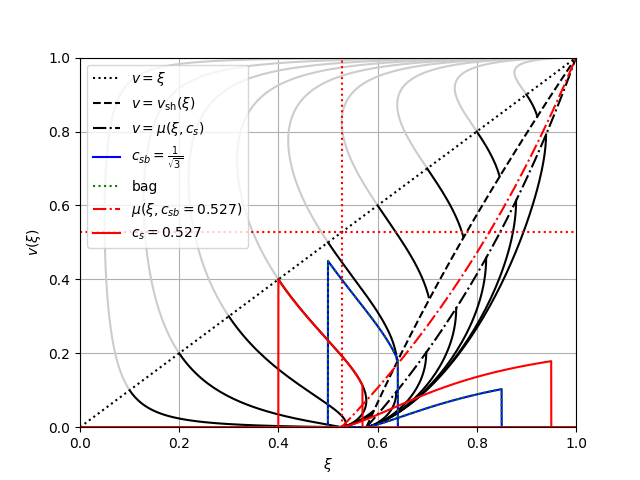
ConstCSModel xi, v plane
Plot the \(\xi, v\) plane for the constant sound speed model
/home/docs/checkouts/readthedocs.org/user_builds/pttools/checkouts/stable/pttools/models/const_cs.py:681: RuntimeWarning: invalid value encountered in scalar multiply
  return w_b * phase + w_s * (1 - phase)
/home/docs/checkouts/readthedocs.org/user_builds/pttools/checkouts/stable/pttools/models/const_cs.py:681: RuntimeWarning: invalid value encountered in scalar multiply
  return w_b * phase + w_s * (1 - phase)
import matplotlib.pyplot as plt
import numpy as np

from examples import utils
from pttools.bubble.bubble import Bubble
from pttools.bubble.fluid_bag import sound_shell_bag
from pttools.bubble.boundary import SolutionType
from pttools.bubble.integrate import add_df_dtau
from pttools.bubble.relativity import lorentz
from pttools.models.const_cs import ConstCSModel
from tests.paper.plane import xiv_plane
from tests.paper.plot_plane_paper import plot_plane


def main():
    css = 1 / np.sqrt(3) - 0.05

    fig: plt.Figure = plt.figure()
    ax: plt.Axes = fig.add_subplot()

    # Plane curves
    model = ConstCSModel(a_s=1.1, a_b=1, css2=css**2, csb2=1/3, V_s=1, V_b=0)
    # model = ConstCSModel(a_s=1.1, a_b=1, css2=1/3, csb2=1/3, V_s=1, V_b=0)
    df_dtau_ptr = add_df_dtau("const_cs", model.cs2)
    data_b, data_s = xiv_plane(df_dtau_ptr=df_dtau_ptr, cs2_s=model.css2, cs2_b=model.csb2)
    plot_plane(ax=ax, data_b=data_b, data_s=data_s, cs2_s=model.css2, cs2_b=model.csb2, selected_solutions=False)

    model2 = ConstCSModel(a_s=1.1, a_b=1, css2=1/3, csb2=1/3, V_s=1, V_b=0)
    det2 = Bubble(model2, v_wall=0.85, alpha_n=0.05, sol_type=SolutionType.DETON)
    ax.plot(det2.xi, det2.v, c="b", label=r"$c_{sb}=\frac{1}{\sqrt{3}}$")
    v, w, xi = sound_shell_bag(v_wall=0.85, alpha_n=0.05)
    ax.plot(xi, v, c="g", label="bag", ls=":")
    def2 = Bubble(model2, v_wall=0.5, alpha_n=0.578, sol_type=SolutionType.SUB_DEF)
    ax.plot(def2.xi, def2.v, c="b")
    v, w, xi = sound_shell_bag(v_wall=0.5, alpha_n=0.578)
    ax.plot(xi, v, c="g", ls=":")

    xi = np.linspace(css, 1, 20)
    ax.plot(xi, lorentz(xi, css), c="r", ls="-.", label=rf"$\mu(\xi,c_{{sb}}={css:.3f})$")

    ax.axvline(css, c="r", ls=":")
    ax.axhline(css, c="r", ls=":")
    model3 = ConstCSModel(a_s=1.1, a_b=1, css2=css**2, csb2=css**2, V_s=1, V_b=0)
    det3 = Bubble(model3, v_wall=0.95, alpha_n=0.15, sol_type=SolutionType.DETON)
    ax.plot(det3.xi, det3.v, c="r", label=rf"$c_{{s}}={css:.3f}$")
    # This can be expected to fail due to the shape of the curve
    def3 = Bubble(model3, v_wall=0.4, alpha_n=0.6)
    ax.plot(def3.xi, def3.v, c="r")

    ax.legend()
    return fig


if __name__ == "__main__":
    fig = main()
    utils.save_and_show(fig, "const_cs_xi_v.png")
Total running time of the script: (0 minutes 9.337 seconds)
Estimated memory usage: 331 MB